Executive Overview

Sales at a glance

Weekly Touch Base Week 34 · Aug 17 – 23, 2026

Where revenue actually came from this week: new vs returning by store. Every row clicks through to its channel page; the full driver detail lives there.

Shopify · Net Sales
$83,953
vs Goal▼ -11.5% vs PW▲ +2.9%
Monthly Goal Pacing
MTD $192.4k of $420k (45.8%)▼ Off Paceproj. 89%
New Customer Rev$19,321+1.1%
Returning Cust Rev$64,632+3.5%
Sol’s read: Stabilization, not recovery: $84.0k (+2.9%) with sessions up 12.2% but CVR down to 2.62% — traffic came back before intent did. New-customer revenue held at $19.3k/wk, still ~40% of what the $120k August plan implies, and discounts deepened to 20.7% of gross to buy the volume. Nord Media’s two linked weeks are now complete — the aMER/scaling conversation is live. MTD $192.4k is 45.8% of plan with 51.6% of the month gone; projection ~89%.
Amazon · Ordered Product Sales
$19,570
vs Goal▼ -33.3% vs PW▼ -16.9%
Monthly Goal Pacing
MTD $48.1k of $130k (37.0%)▼ Off Paceproj. 69%
New Cust Rev (AFN W32)$7,732vs Goal-14.4%
Returning Rev (AFN W32)$13,761vs Goal+35.4%
split not refreshed — data as of Aug 9 · AFN daily download cap hit Aug 21 (refresh Monday)
Sol’s read: First clean full-week read in a month and it’s a real drop: $19.6k vs a restated $23.6k last week (−16.9%) — last week’s “flattening” was a 6-day artifact. Traffic was flat (1,165 sessions) but units fell 16.8%, so this is conversion, not demand; ASP held at $104. Ads answered the budget restore (+19.2% ad sales at 3.44 ROAS), so the organic side is doing the leaking. New/returning split is stuck on Aug 9 data — Seller Central’s daily download cap blocked the AFN pull today; it refreshes with Monday’s run.
Monthly goals: Shopify $420k · Amazon $130k (subchannel goals: Shopify New $120k / Returning $300k · Amazon New $40k / Returning $45k) · Amazon split refreshed each Monday from the exact-dates AFN report (this run: blocked by the AFN daily download cap — split as of Aug 9) · cards click through to channel pages.
Sunny Within · Weekly Touch Base
Sales channels only · Shopify: ShopifyQL · Amazon: AFN warehouse
Slide 0 · Executive
Sales · Shopify

$84.0k, up 2.9% — traffic came back before intent did

Weekly Touch Base Week 34 · Aug 17 – 23, 2026
Sol’s read

The week turned on traffic: sessions jumped +12.2% to 9,920 and total sales followed to $83,953 (+2.9%), but CVR slipped again to 2.62% (−0.33pt) — volume showed up before intent did. Discounts deepened to 20.7% of gross (+4.0pt), which financed the AOV lift to $93.55 (+3.1%); the Deep Dive walks the gross-to-net cost of that depth. New-customer revenue stabilized at $19.3k (+1.1%) and returning rose 3.5% to $64.6k. Checkout completion improved a second straight week (+1.7pt to 50.8%) — the funnel leak has moved upstream to cart→checkout (−10.3pt). vs PY not pulled this run.

Net Sales
$83,953
vs Goal-11.5% vs PW+2.9% vs PYn/a this run
Monthly Goal Pacing
Traffic (Sessions)
9,920Goal-9.8%
vs PW +12.2% · MTD 21,521
CVR
2.62%Goal-1.38pt
vs PW -0.33pt · traffic outran intent
Orders
886Goal-15.7%
PW -1.4% · MTD 2,060
AOV
$93.55Goal-2.8%
PW +3.1% · discounts deepened to 20.7% of gross
New Customer Rev
$19.3kGoal-28.7%
vs PW +1.1% · MTD $46.1k
Returning Cust Rev
$64.6kGoal-4.6%
vs PW +3.5% · MTD $146.4k
Net Sales · Trailing 13 Weeks Current week highlighted · dashed = weekly goal
Sunny Within · Weekly Touch Base
Source: Shopify Analytics (ShopifyQL)
Slide 2 · Shopify
Sales · Amazon

OPS $19.6k on a restated full week — down 16.9%, and it’s conversion

Weekly Touch Base Week 34 · Aug 17 – 23, 2026
Sol’s read

Two corrections first: this is a full 7-day week (complete through Aug 16, no lag) and W32 restates to $23,556 — last week’s $19,799 print was a 6-day read, so the “flattening” call was an artifact. Against the honest base, W33’s $19,570 is −16.9%, and the driver is conversion: sessions were flat (1,165 vs 1,175) while units fell 16.8% to 188; ASP held at $104.10 — the Deep Dive isolates the order-item-% drop. MTD is $48,065, 37.0% of the $130k month. The AFN new/returning split is blocked again (Seller Central daily download cap hit Aug 21); the split on the nested pages still reads as of Aug 9.

Ordered Product Sales
$19,570
vs Goal-33.3% vs PW-16.9% vs PYn/a this run
Monthly Goal Pacing
Sessions
1,165PW-0.9%
full week Aug 10–16, no lag · W32 full-week restated: 1,175 sessions
Order Item %
16.1%PW-3.1pt
188 units ÷ 1,165 sessions · W32 restated 19.2% — conversion is the leak
Avg Sales / Order Item
$104.10Goal-0.9%
vs PW -0.1% · 188 order items · W32 restated $104.23
Ordered Product Sales · Trailing 13 Weeks Current week highlighted · dashed = weekly goal
Sunny Within · Weekly Touch Base
Source: Windsor · Amazon Seller (Sales & Traffic Report)
Slide 3 · Amazon
Growth · Meta

aMER 0.81 — spend rose 8% into a gate that says don’t

Weekly Touch Base Week 34 · Aug 17 – 23, 2026
Sol’s read

Nord Media’s second full week — the two linked weeks are now complete — and the buying got cheaper without getting more productive: spend rose 8.3% to $23.7k while CPM fell 13.3% to $61.81, CTR climbed to 1.67%, and purchases jumped to 142 (CPP $167.01, −15.4%). The king barely moved: new-customer revenue $19,321 (+1.1% WoW), so aMER slid 0.87→0.81 — the extra dollars bought impressions, not new customers. MTD the king basis sits at $46.1k against the $120k August goal. That tension is the diagnosis (see the Deep Dive diagnosis line): the house gate says no Meta scaling while aMER is below goal, yet spend rose ~8% while aMER fell — hold Nord Media to the gate and let creative, not budget, carry week three.

New Customer Revenue
$19,321
vs Goal-35.6% vs PW+1.1% vs PYn/a this run
Monthly Goal Pacing
CPM
$61.81Goal-8.5%
vs PW -13.3%
Spend $23.7k on 384k impressions
CTR
1.67%Goal-0.03pt
vs PW +0.13pt
delivery improved under the new buying
aMER
0.81Goal-0.34
vs PW -0.06 · below 1.0 — spend exceeded
new-customer revenue again
Cost / Purchase
$167.01Goal+18%
vs PW -15.4% · 142 purchases
on $23.7k spend
Purchase Rate / LPV
3.45%Goal-0.75pt
vs PW +0.04pt · 4,121 LPVs
vs 3,257 last week
New Customer Revenue · Trailing 13 Weeks Current week highlighted · dashed = weekly share of the $100k New plan ($22.4k)
Sunny Within · Weekly Touch Base
Source: Windsor · Meta Ads · New Cust Rev: Shopify
Slide 5 · Meta
Growth · Amazon Advertising

Budgets restored, sales answered +19.2% — still $2.2k short of goal

Weekly Touch Base Week 34 · Aug 17 – 23, 2026
Sol’s read

Spend came back: $2,126 this week (+119.6% off the W32 dip) and ad-attributed sales followed to $7,319 (+19.2%) at a blended ROAS of 3.44 — the W32 collapse reads as the anomaly, not a trend change. SP did the volume ($6,395 on $1,806); SB added $924 with 63.4% new-to-brand ($586); SD was idle. SP CPC printed $2.27, +8.1% on last week’s SP-only read — the Deep Dive flags it as the structural watch item. MTD is clean this run: $17,123 sales on $4,491 spend, date-bounded Aug 1–16, no estimate carried. One caveat: 14-day attribution restates the newest days upward, so this week will read better next Monday.

Ad-Attributed Sales
$7,319
vs Goal-23.0% vs PW+19.2% vs PYn/a this run
Monthly Goal Pacing
Spend
$2,126Goal-14.4%
vs PW +119.6%
MTD $4,491 — date-bounded, complete
New Cust Rev (Ad-Attr.)
$586NTBSB only
vs PW +84.9% · NTB read = SB only
63.4% of SB sales ($924) is new-to-brand
ROAS
3.44Goal-0.32
vs PW -2.90 · W32’s 6.34 was low-spend inflated
14d attribution still filling for W33
Clicks
794*SP only
*SP clicks; SB/SD click detail not pulled
vs PW SP-only +101%
CPC
$2.27*SP only
*SP-only basis ($1,806 ÷ 794 clicks)
vs PW $2.10 +8.1%
Amazon Ad Spend · Sponsored Products · Trailing 13 Weeks Current week highlighted · dashed = weekly share of the $10k CFO spend plan
Sunny Within · Weekly Touch Base
Source: Windsor · Amazon Ads (SP + SB + SD, 14d) · New Cust = New-to-Brand (SB/SD)
Slide 6 · Amazon Advertising
Growth · Meta CRO

Intent surged 39% — the cart→checkout handoff gave it back

Weekly Touch Base Week 34 · Aug 17 – 23, 2026
Sol’s read

Volume arrived and mostly converted: LPVs rose 26.5% to 4,121, ATCs jumped 39.1% to 459 (11.1% of LPVs) and checkouts followed at +24.5% to 346 — PR/LPV ticked up to 3.45% (+0.04pt), still 0.75pt under the 4.20% goal. But the leak moved back a step: ATC→checkout gave back last week’s recovery (84.2%→75.4%) while checkout→purchase held at 41.0%. Session quality was flat-to-better: GA4 shows 4,340 paid sessions at 1:15 average duration, so the new buying is bringing real intent that stalls at the cart handoff. The Deep Dive diagnosis points the fix there — and W4’s no-template-change rule during live tests still applies.

Purchase Rate per Landing Page View
3.45%
vs Goal-0.75pt vs PW+0.04pt vs PYn/a this run
Monthly Goal Pacing
Traffic (Landing Page Views)
4,121Goal+2.0%
vs PW +26.5% · GA4 paid sessions: 4,340
the spend rise landed here
Add to Carts
1:15Goal-0:19
vs PW +0:02 · GA4, Meta paid only
quality held as volume rose
Add to Carts
459Goal+0.6pt
11.1% of LPVs (up from 10.1%)
intent surged with the new traffic
Checkouts Initiated
346Goal+0.2pt
8.4% of LPVs · 75.4% of ATCs (was 84.2%)
ATC→IC gave back its recovery
Funnel metrics (LPV, ATC, checkout, purchase) are Meta-pixel-attributed and share one attribution window — rates are internally consistent. Session duration is GA4 (Meta has no on-site time metric); GA4 counts differ from Meta by design.
Purchase Rate per LPV · Trailing 13 Weeks Current week highlighted · dashed = goal
Sunny Within · Weekly Touch Base
Source: Windsor · Meta Ads (pixel funnel) + GA4 (session duration)
Slide 10 · Meta CRO
Growth · Google Ads

ROAS 2.15 on restated books — non-brand claws back to 0.99

Weekly Touch Base Week 34 · Aug 17 – 23, 2026
Sol’s read

First, the restatement: W32 re-pulled Aug 21 came back 16% higher at $5,007 — Google restates conversions for days, so week-one reads are provisional. Against that restated base, W33 printed $4,810 of conversion value on $2,240 spend (ROAS 2.15 blended), −3.9% WoW and −39.9% vs the $8k weekly goal. The shape improved where it matters: brand made 67% of the value at 4.92 ROAS, and non-brand climbed to 0.99 from 0.43 restated — Longevity PMax went 0.13→0.72 under its reset 1.20 tROAS (the Deep Dive diagnosis carries the campaign-level call). This was the first week under the unlocked G5 budget gate; no account-level moves were made yet — that call is queued. GA4 cross-check not re-pulled this run. Team notes: click to annotate.

Google Ads Conversion Value
$4,810
vs Goal-39.9% vs PW (restated)-3.9%
Monthly Goal Pacing
Spend
$2,240MTD$5,105
Brand $658 (29%) · Non-brand $1,582 (71%)
7 campaigns spending
ROAS
2.15NB only0.99
Brand 4.92 · Non-brand 0.99
Longevity PMax: 0.72 vs reset 1.20 tROAS target
Brand Share of Value
67%incrementalityquestion
$3,238 of $4,810 from brand terms/feeds
much would arrive via organic anyway
CPC / CTR
$2.60CTR0.78%
862 clicks · 110.0k impressions
GA4 cross-check not re-pulled this run
Google Ad Spend · Trailing 13 Weeks Windsor google_ads spend, Mon–Sun · dashed line = the $8,000 weekly plan · spend does not restate
Sunny Within · Weekly Touch Base
Source: Windsor Google Ads (live as of Aug 4) · GA4 google/cpc cross-check
Slide 16 · Google Ads
Retention · Klaviyo

$8.5k attributed — +52% WoW, still 10.1% of Shopify vs the 35% bar

Weekly Touch Base Week 34 · Aug 17 – 23, 2026
Sol’s read

Same thin calendar — again 3 email campaigns + 1 SMS, all Content-tagged, no offer-led send — but this week the engaged-list sends landed: attributed revenue jumped +52.4% to $8,456, 10.1% of Shopify against the 35% bar. 8.12 NAD Ingredients ($1,917) and 8.16 Creatine Testimonials ($1,847) carried campaigns; the 365-day-list Creatine Myths send managed $199. Flows rose +28.1% to $4,231 (Welcome Series $1,118) while browse-abandon stayed dormant at $97. Engaged list ticked up +24 to 43,242. Pace: the $147k monthly goal has MTD at ~$16.5k — the Deep Dive holds the send-by-send read and the offer-send call.

Attributed Revenue
$8,456
vs Goal-71.2% Share of Shopify10.1% vs 35% vs PW+52.4%
Monthly Goal Pacing
Campaign Performance
$4,224Goal+5.6%
3 email + 1 SMS · 43 orders · top: 8.12 NAD Ingredients $1,917
SMS 8.14 Creatine Myths $261
Flow Performance
$4,231Goal+20.9%
vs PW +28.1% · top flow Welcome Series $1,118
browse-abandon still dormant ($97)
Open Rate
60.6%Goal+2.6pt
vs PW -0.9pt · delivered-weighted, email only
engaged-list sends dominate the mix
Email Subscribers | Engaged 365 Days
+24vs Aug 10 snapshot
Segment total 43,242 · vs 43,218 on Aug 10
next baseline: 43,242 (2026-08-21)
*Email Subscribers | Engaged 365 Days = net week-over-week change in Klaviyo segment Xhmc6a — engaged, email-consented profiles active in the last 365 days, bot-filtered. Measures growth of the engaged list, not raw signups.
Attributed Revenue · Trailing 13 Weeks Current week highlighted · dashed = weekly goal
Sunny Within · Weekly Touch Base
Source: Klaviyo (campaign + flow values reports, Placed Order)
Slide 8 · Klaviyo
Retention · Skio Subscriptions

$71.9k sub revenue on the new API basis — +1.4% WoW, but the base shed 82 subs

Weekly Touch Base Week 34 · Aug 17 – 23, 2026
Sol’s read

Basis switch: W33 is the first week read from the Skio MCP API, which runs ~3% above the old browser basis (W32 comparable: $70,877 vs $68,520) — on like-for-like, sub revenue rose +1.4% to $71,904, still 29.2% under the $101.6k goal line. Subscriptions remain the store: ~82.6% of orders (732 of 886) and ~85.7% of revenue (Skio billed vs Shopify total sales — different bases, quote with care). The base shed 82 subs (4,797 → 4,715) on 218 completed cancels vs 147 first-time subs; the cancel flow saved 15 of 233 decided sessions (6.44% — vs W32’s 7.7% of 168, denominators differ). Retention: trailing-3 held at 47.6% vs the 50% goal, and the June cohort is tracking 50.8% at month 3 in progress — the first improving signal. Deep Dive has the reason-by-reason save math. Team notes: click to annotate.

Subscription Revenue (W33)
$71,904
vs Goal-29.2% vs PW+1.4%
3-Month Retention vs 50% Goal
Active Subscriptions
4,715WoW-1.7%
net -82 this wk · 147 first-time subs
MRR $421.7k (list-price basis, Aug 21)
New Subscriptions (W33)
147WoW+1%
First-sub AOV $93 vs recurring $100
First-sub = 19.3% of sub revenue
Cancellations (W33)
218WoW+7%
weekly churn 4.5% · deflection 6.44% (15 of 233)
Saves: discount 4 · skip 4 · pause 3 · swap 2
Why They Cancel (W33)
Too much product · 19%
Taste / texture 17% · Too expensive 14%
No longer use · 14%
Top Subscribed by SKU
1. Longevity · 2,051 subs · 43%
2. Longevity Strawberry · 1,873 · 39%
3. Cognitive · 500 · 10%
Subscription Revenue · Weekly vs $450k/mo Goal dashed = $101.6k weekly goal · basis switched W33 (API): Skio MCP reads ~3% above the old browser basis (W32: $70,877 vs $68,520)
Sunny Within · Weekly Touch Base
Source: Skio MCP API (basis switched W33) · W33 window Aug 10 – 16
Slide 9 · Skio
Customer Service · Gorgias

AI Agent week two: automation 56.6% smashed the 30% target, CSAT dipped to 4.50

Weekly Touch Base Week 34 · Aug 17 – 23, 2026
Sol’s read

Week two of AI Agent settled the question: automation printed 56.6% (target 30%+) and median first response fell from 5m40s to 30 seconds. The trade: CSAT eased below goal to 4.50 (n=14 of 77; 18.2% response) — the survey now hears from everyone who gets an instant AI answer, not just the patient. Tickets rose 15% to 128. Ignore the scary 83.9h average FRT — that is agents clearing pre-launch backlog, not new-ticket speed; the Deep Dive separates the two. Watch: audit low-scored AI conversations before pushing coverage higher.

Average CSAT
4.50
vs Goal-0.10 vs PW-0.14 vs PYn/a this run
Monthly Goal Pacing
Created Tickets
128vs PW+15.3%
volume up again in AI Agent week two
First Response Time
30sGoalbeats 4h
Median · avg 83.9h is backlog cleanup, not new-ticket speed
Goal 4h · AI Agent answers first on most tickets
AI Automation Rate
56.6%Goal+26.6pt
AI Agent week two · 30%+ target cleared
watch quality before pushing coverage higher
Revenue / Interaction
Not active
Requires Shopping Assistant
Reports automatically once enabled
CSAT n = 14 scored surveys of 77 sent (18.2% response rate) — small weekly samples will swing; the 13-week trend below is the honest read. Surveys are email-only (~all closed email tickets; ~17.6% historical response).
Average CSAT · Trailing 13 Weeks Current week highlighted · dashed = goal (4.60)
Sunny Within · Weekly Touch Base
Source: Gorgias Reporting (surveys, tickets, FRT, automation)
Slide 11 · Gorgias
Organic Social · Instagram

Engagement doubled on one breakout day — reach gave back 8.7%

Weekly Touch Base Week 34 · Aug 17 – 23, 2026
Sol’s read

Depth won the week: interactions more than doubled to 2,421 (+118.1%) and accounts engaged jumped to 1,694 (+125.6%), driven almost entirely by an Aug 15 spike — 1,005 interactions and 709 accounts engaged in a single day. Reach gave back 8.7% to 74.5k and new follows eased to 234 (−11.7%), so one post did the work while distribution rested. Engagement rate (interactions ÷ reach) hit 3.25% vs 1.36% last week. The Deep Dive isolates the spike; the job now is identifying that Aug 15 post and making its format a weekly fixture without losing the reach machine.

Reach
74,541
vs Goal-12.3% vs PW-8.7% vs PYn/a this run
Monthly Goal Pacing
Engagement Rate
3.25%Goal+1.76pt
2,421 interactions ÷ reach (W32 same basis: 1.36%)
vs PW +1.89pt · Aug 15 spike did the lifting
Total Interactions
2,421Goal+63.4%
vs PW +118.1% · best day Aug 15 (1,005)
single-day spike drove the week
New Followers
+234Goal+17.0%
vs PW -11.7% · daily new follows, not total
engagement spike didn’t convert to follows
Posts Published
not pulled
post-level pull skipped this run
resumes next refresh
Reach = sum of daily unique reach (a user reached on two days counts twice) — consistent week to week, but not deduplicated weekly uniques. MTD deduped period reach (Aug 1–16) = 95,016, below the sum of weekly dailies as expected. Source: Instagram Insights via Windsor (@getsunnywithin only).
Total Interactions · Trailing 13 Weeks Current week highlighted · dashed = weekly goal
Sunny Within · Weekly Touch Base
Source: Windsor · Instagram Insights (@getsunnywithin)
Slide 13 · Instagram
Organic · Organic Search Rankings

Sessions gave back 13.6% — brand terms rebounded to #1, glutathione comparisons slipped

Weekly Touch Base Week 34 · Aug 17 – 23, 2026
Sol’s read

Organic sessions eased to 610 (−13.6% vs 706) — still just above the 600 weekly goal, so last week’s jump partially held. The query rank-diff (O1, pulled this run) explains the mix: brand-commercial terms rebounded hard (“sunny within longevity” 5.8 → 1.0, “sunny within supplements” 23.8 → 3.7) while the glutathione-comparison cluster slipped 1–3 spots, nudging weighted position to 12.95. Clicks actually rose to 264 on 7,241 impressions (3.65% CTR). AEO: AI SoV printed 99.7%, #1 of 5 — but Ahrefs switched the report to “AI-adjusted volume” methodology, so it is not comparable to the 86.4% baseline; the cleaner signal is cited pages (22 own vs 0 competitor of 74) and PubMed/NIH displacing Reddit as top sources — the Deep Dive has the read.

Organic Search Traffic
610
vs Goal+1.7% vs PW-13.6% vs PYn/a this run
Monthly Goal Pacing
Rankings
12.95vs PW+0.25
Avg position eased (12.7 → 12.95)
264 clicks · 7,241 impr · 3.65% CTR (full week present)
Organic Search Revenue
not pulled
organic revenue split skipped this run
resumes next refresh
AEO Visibility
99.7%AI SoV#1 of 5
Methodology changed (AI-adjusted volume) — not comparable to 86.4% baseline
Latest responses: SW 2 (ChatGPT 1, Perplexity 1) · Quicksilver 1 · LivOn/Altrient/Thorne 0 · budget 136/150
Engaged Session Rate
not pulled
engaged-organic split skipped this run
resumes next refresh
Traffic: GA4 medium=organic (pinned definition). Rankings: Google Search Console via Windsor (avg position is impression-weighted; ~2-day lag but the full week is present this run). AEO visibility: Ahrefs Brand Radar report “Sunny Within - AEO (Weekly Touch Base)” checked Aug 21 — Ahrefs switched to AI-adjusted volume (old calc available until Aug 31), so SoV is not comparable to the Aug 11 baseline of 86.4%.
Organic Search Sessions · Trailing 13 Weeks Current week highlighted · dashed = weekly goal
Sunny Within · Weekly Touch Base
Source: Windsor · GA4 + Search Console · AEO: Ahrefs Brand Radar (browser-read)
Slide 14 · Organic Search Rankings
Product · Product Performance

Strawberry takes #1 and NAD+ jumps 50% — welcome offers do the acquiring

Weekly Touch Base Week 34 · Aug 17 – 23, 2026
Shopify Amazon
Ranked by Shopify total sales, W33 new + returning · stats = share of total · share of new-customer sales · Skio actives
Amazon ASIN split unavailable this run — bars read Shopify-only · actives by SKU: Aug 10 snapshot · Also W33: Sleep $3.3k · Immunity $2.0k · NAD+ Welcome Offer $1.9k · Creatine+ $1.2k
1. Longevity — Strawberry$24.6k Shopify · +4.1% WoW
29.3%of total sales
13.0%of new cust sales
1,873actives · Aug 10
2. Longevity$23.3k Shopify · -7.5% WoW
27.8%of total sales
5.8%of new cust sales
2,051actives · Aug 10
3. NAD+ Complete$6.8k Shopify · +50.2% WoW
8.1%of total sales
12.2%of new cust sales
actives n/a
4. Cognitive$5.4k Shopify · +13.1% WoW
6.5%of total sales
3.8%of new cust sales
500actives · Aug 10
5. LS Welcome Offer$3.8k Shopify · -43.0% WoW
4.6%of total sales
19.8%of new cust sales
new-cust only
Read on the mix — editable weekly
E.g.: “NAD+ over-indexes on new customers (51% of new-customer sales vs 43% of total) — it’s the acquisition product. Glutathione under-indexes on new but holds the #2 sub rate — the retention product.”
Sources: Shopify by product (ShopifyQL, incl. new/returning split) · Amazon by ASIN (Windsor) unavailable this run · Skio actives by SKU: Aug 10 snapshot (pagination too heavy to re-pull this run).
Sunny Within · Weekly Touch Base
Source: Shopify + Windsor (Amazon) + Skio
Slide 15 · Product Performance
Creative · Brand Team

Creative needs for the final stretch of July

Weekly Touch Base Week 34 · Aug 17 – 23, 2026
Brand team summary — subjective read on what creative is working, what’s fatiguing, and where the biggest opportunities are. Write freely here: themes, angles, formats, creators, references.
Meta
Asks: 3× UGC hooks on the hydration angle to fight CPM fatigue; 2× statics for the week-4 offer push.
Context: CPMs +8.6% vs goal, PR/LPV winner ready to scale.
Owner / due: Creator team · Friday.
Amazon Ads
Asks: Open text — sponsored brand video refresh, A+ imagery, brand store seasonal update…
Context:
Owner / due:
Google
Asks: Open text — PMax asset groups, YouTube cutdowns, seasonal search creative…
Context:
Owner / due:
Click any text block to edit · edits save locally · pacing chips fill automatically from each Growth channel’s monthly projection
Sunny Within · Weekly Touch Base
Owned by Brand Team · Pacing chips: auto from Growth
Creative Needs
Sales · Shopify · Deep Dive

Traffic bought the week; discounts paid for it

Weekly Touch Base Week 34 · Aug 17 – 23, 2026
MetricThis WkLast WkWoWMTDvs Goal
Net Sales$81,867$81,555▲ 2.9%$192.4k-11.5%
Gross Sales$104,475$99,228▲ 5.3%
Discountslower = better−$21,590−$16,56520.7% of gross+4.0pt vs W32
Returnslower = better−$1,942−$3,913▼ 50.4%improving
Net Sales$80,944$78,749▲ 2.8%
Orders886899▼ 1.4%2,060-15.7%
AOV$93.55$90.72▲ 3.1%$93.41-2.8%
Sessions9,9208,843▲ 12.2%21,521-9.8%
CVR2.62%2.95%▼ 0.33pt2.89%-1.38pt
New Customer Rev$19,321$19,120▲ 1.1%$46.1k-28.7%
Returning Cust Rev$64,632$62,435▲ 3.5%$146.4k-4.6%
Diagnosis: The +2.9% week is traffic-led (sessions +12.2%) and discount-financed (20.7% of gross, +4.0pt) — CVR fell to 2.62% and the funnel leak moved upstream: ATC→checkout dropped 10.3pt while checkout completion repaired to 50.8% (+1.7pt). Call: Chase the cart→checkout drop (Website Analytics owns it) and cap discount depth before it resets AOV expectations — the weekly goal gap is still −11.5%.
Top Products (Net Sales)
1. Longevity — Strawberry · $24.6k · +4%
2. Longevity · $23.3k · -8%
3. NAD+ Complete · $6.8k · +50%
4. Cognitive · $5.4k · +13%
5. LS Welcome Offer · $3.8k · -43%
Funnel Read (vs W32)
Session → ATC 6.4% -0.2pt
ATC → Checkout 81.0% -10.3pt
Checkout → Purchase 50.8% +1.7pt
Story: new traffic carted at the usual rate, but the
leak moved to cart→checkout while pay-completion healed
Annotations — this week
Click to edit. E.g.: “Bundle price test started Wed — explains AOV jump and order dip. Returns spike traces to one damaged Glutathione lot (ticket #4512). Watch checkout completion — Shop Pay outage Thursday 2–4pm.”
Sunny Within · Weekly Touch Base
Source: Shopify Analytics (ShopifyQL) · annotations save locally
Shopify · Deep Dive Analytics
Sales · Shopify · Visual Analytics

A traffic week in four frames — Thursday carried it

Weekly Touch Base Week 34 · Aug 17 – 23, 2026
Conversion Funnel2.62% end-to-end
Daily Rhythm · Net SalesW33 daily vs W32 avg $11.7k/day
Customer Mix · 13 Weeksnew vs returning revenue
Orders vs AOV · 13 Weeksbars = orders · line = AOV
Sunny Within · Weekly Touch Base
Source: Shopify Analytics (ShopifyQL)
Shopify · Visual Analytics
Growth · Meta · Deep Dive

The extra $1.8k bought reach, not revenue

Weekly Touch Base Week 34 · Aug 17 – 23, 2026
MetricThis WkW32WoWMTD (Aug)vs Goal
NC Revenue (Shopify)$19,321$19,120▲ 1.1%$46.1k-35.6%
Spend$23,716$21.9k▲ 8.3%
aMER0.810.87▼ 0.06-0.34
Impressions383,681307k▲ 25.0%
CPMlower = better$61.81$71.30▼ 13.3%-8.5%
Clicks / CTR6,424 · 1.67%≈4.7k · 1.54%▲ 0.13pt-0.03pt
Landing Page Views4,1213,257▲ 26.5%+2.0%
Add to Carts (rate)459 · 11.1%330 · 10.1%▲ 1.0pt+0.6pt
Checkouts (of ATC)346 · 75.4%278 · 84.2%▼ 8.8pt-8.8pt
Purchases142111▲ 27.9%
Cost / Purchase$167.01$197.31▼ 15.4%+18%
PR / LPV3.45%3.41%▲ 0.04pt-0.75pt
Diagnosis: aMER fell 0.87→0.81 because spend rose 8.3% to $23.7k while NC revenue only matched it at +1.1% — cheaper delivery (CPM $61.81, CPP $167.01) isn’t converting into incremental new customers. Call: Hold spend at or below $21.9k until aMER re-approaches goal — house gate: no Meta scaling while aMER is below goal, and this week’s ~8% spend rise ran straight against it.
Efficiency Read
Spend $21.9k → $23.7k (+8.3%) in NM week two
CPM −13.3% to $61.81 → impressions +25%
Pixel purchase value $14.4k on $23.7k spend
Cheaper reach isn’t minting new customers yet —
the aMER gate is the binding constraint
Funnel Read (vs W32)
LPV → ATC 11.1% +1.0pt — intent up
ATC → Checkout 75.4% -8.8pt — the give-back
Checkout → Purchase 41.0% +1.1pt
Story: new traffic wants the product but
stalls at cart — same read as Meta CRO
Annotations — this week
Click to edit. E.g.: “NAD Bundles launch traffic routed to bundle LP Wed–Sun. Fatigue kills executed on 3 ad sets Thursday. Nord Media inherits this account 8/10 — freeze structural changes after Friday.”
Sunny Within · Weekly Touch Base
Source: Windsor Meta pixel + ShopifyQL (NC rev) · annotations save locally
Meta · Deep Dive Analytics
Sales · Amazon · Deep Dive

Flat traffic, 17% fewer units — the ASINs stopped converting

Weekly Touch Base Week 34 · Aug 17 – 23, 2026
MetricThis WkLast WkWoWMTDvs Goal
Ordered Product Sales$19,570$23,556*▼ 16.9%$48.1k-33.3%
Order Itemsunits188226▼ 16.8%
Avg Sales / Order Item$104.10$104.23▼ 0.1%-0.9%
Sessionsfull week, no lag1,1651,175▼ 0.9%complete
Order Item %units ÷ sessions16.1%19.2%▼ 3.1ptthe leak
New Customer Rev (AFN)shipment basis · as of Aug 9$6,655$8,086▼ 17.7%49.0% new
Returning Cust Rev (AFN)shipment basis · as of Aug 9$6,940$9,545▼ 27.3%
Diagnosis: *W32 restates to $23,556 (full week; the $19.8k print was a 6-day read) — against that base W33 fell 16.9% on conversion: sessions flat (−0.9%) but order item % dropped 3.1pt to 16.1%, with ASP steady at $104.10. Call: Listing-level conversion work (price/reviews/content) on the top ASINs, not traffic spend; re-pull the AFN split when the download cap resets — the new/returning question is now three weeks old.
Where the drop lives
Sessions flat (1,165 vs 1,175) while units fell 16.8% — conversion, not traffic, is the leak; ASP held at $104.10.
MTD $48,065 = 37.0% of the $130k month with 52% of the days gone.
W32 restated to $23,556 — last week’s “flattening” was a 6-day artifact.
Cross-check vs Ads
Ad-attributed sales $7,319 = 37.4% of OPS (W32: 26.1%) — ads rebounded while organic conversion fell.
Traffic flat + order item % down 3.1pt points at the listing (price/reviews/content), not the ads (A9 rule).
Annotations — this week
Click to edit. E.g.: price test on NAD+ ASIN started Jul 29; Prime-exclusive coupon ended Jul 27 — likely the volume cliff.
Sunny Within · Weekly Touch Base
Source: Windsor Amazon Seller (Sales & Traffic) · W33 complete through Aug 16 · AFN warehouse split as of Aug 9 (daily cap)
Amazon · Deep Dive Analytics
Growth · Amazon Advertising · Deep Dive

Spend restored, sales answered — efficiency held at 3.44

Weekly Touch Base Week 34 · Aug 17 – 23, 2026
MetricThis WkLast WkWoWMTDvs Goal
Ad-Attributed Sales14-day attr$7,319$6,138▲ 19.2%$17.1k-23.0%
Spend$2,126$968▲ 119.6%$4,491-14.4% (under)
ROASblended3.446.34▼ 2.903.81-0.32
New-to-Brand Rev (SB)63.4% of SB sales$586$317▲ 84.9%SB only
ClicksSP only794395▲ 101%SP basis
CPCSP only · higher = worse$2.27$2.10▼ +8.1%SP basis
Diagnosis: The W32 spend collapse reversed (+119.6% to $2,126) and sales answered +19.2% at ROAS 3.44 — last week’s 6.34 was low-spend inflation, not a new efficiency level; SP CPC $2.27 (+8.1%) is the structural watch item. Call: Hold spend at this level and push SP where ROAS ≥ 3; keep SB running for NTB (63.4% of SB sales); re-read W33 next Monday once 14-day attribution fills.
Read on the rebound
SP did the volume: $6,395 on $1,806 (ROAS 3.54).
SB added $924 on $319 with $586 NTB (63.4%) — still the acquisition engine; SD was idle ($0.85).
Blended 3.44 is healthy — the gap to goal (−23.0%) is volume, not efficiency.
Data freshness
MTD is complete this run: $17,123 sales on $4,491 spend, date-bounded Aug 1–16 — no estimate carried.
14-day attribution restates the newest days upward, so W33 will read modestly better next Monday.
SB/SD click detail still not pulled — clicks and CPC remain SP-only reads.
Annotations — this week
Click to edit. E.g.: harvested 6 search terms to exact Wed; NAD+ defense campaign budget cap hit Fri 8pm — raise or accept.
Sunny Within · Weekly Touch Base
Source: Windsor Amazon Ads (SP + SB + SD, 14-day attribution) · MTD date-bounded Aug 1–16, complete
Amazon Advertising · Deep Dive Analytics
Growth · Meta CRO · Deep Dive

The funnel filled up top — the leak re-opened at cart→checkout

Weekly Touch Base Week 34 · Aug 17 – 23, 2026
MetricThis WkLast WkWoWMTDvs Goal
Purchase Rate / LPV3.45%3.41% (W32)▲ 0.04pt-0.75pt
Landing Page Views4,1213,257▲ 26.5%+2.0%
Add to Carts459 (11.1%)330 (10.1%)▲ 39.1%+0.6pt
Checkouts Initiated346 (8.4%)278 (8.5%)▲ 24.5%ATC→IC 75.4%
Purchases (pixel)142111▲ 27.9%
Meta Avg Purchase ValueMeta-reported value ÷ purchases1:151:13 (W32)▲ 0:02-0:19
Diagnosis: PR/LPV 3.45% (+0.04pt, goal 4.20%) — intent surged (LPV→ATC 11.1%, ATCs +39.1%) but ATC→IC gave back its recovery (84.2%→75.4%) while IC→purchase held at 41.0%. Call: Re-run the cart→checkout friction sweep against the new traffic mix — W4 gate holds: no template changes during live tests.
Funnel autopsy
LPV→ATC up (+1.0pt to 11.1%) on 26.5% more LPVs, but ATC→IC gave back the W32 recovery, 84.2%→75.4% — buyers stall again at cart.
IC→purchase held at 41.0% and session duration ticked up to 1:15 — traffic quality is fine.
Fix order: cart→checkout handoff first (this page), then keep feeding creative (Meta board).
Cross-channel tie
Same-week Shopify sitewide: checkout completion rose to 50.8% (from 49.1%) while Meta’s ATC→IC fell — this leak looks Meta-traffic-specific, not site-wide.
Check: cart handoff on the offer LPs taking the new NM traffic, Shop Pay eligibility on paid landers, discount display at cart.
Annotations — this week
Click to edit. E.g.: LP-B won the PR/LPV test (4.1% vs 3.4%) — assigned to all prospecting Fri; checkout A/B queued.
Sunny Within · Weekly Touch Base
Source: Windsor Meta pixel funnel + GA4 (session duration) · one attribution window, internally consistent
Meta CRO · Deep Dive Analytics
Growth · Google Ads · Deep Dive

Campaign by campaign: the tROAS reset is working — brand still pays

Weekly Touch Base Week 34 · Aug 17 – 23, 2026
CampaignSpendClicksConv.ValueROAS
Brand · PMax Feed Only · New Offer PDP$36520623.7$2,0125.51
Brand · Search · tSI 95%$781336.5$1,01813.1
Brand · Shopping · US All Products$1581042$1450.91
Brand · Shopping · tROAS 900%$57341$631.11
NB · PMax Longevityreset tROAS 120% · was 0.13$1,2572738.35$9000.72
NB · PMax Feed Only · Sleepthe non-brand bright spot$161522.11$5433.38
NB · PMax Feed Only · Product Segment$164601$1290.79
TOTAL$2,24086244.7$4,8102.15
Diagnosis: $4,810 value, −3.9% WoW on the restated W32 base ($5,007 — Google restates conversions for days) — brand at 4.92 ROAS carries 67% of value while NB recovered 0.43→0.99, led by Longevity PMax 0.13→0.72 on its reset 1.20 tROAS. Call: First week under the unlocked G5 budget gate and we held — use it next week: shift budget toward Brand PDP PMax (5.51) and NB Sleep (3.38), give Longevity one more week at 1.20 before cutting.
Two businesses in one account
Brand: $658 spend → $3,238 value (4.92 ROAS) — defense + harvest, mostly non-incremental.
Non-brand: $1,582 spend → $1,572 value (0.99 ROAS) — the actual acquisition test just clawed back to break-even from 0.43 restated, led by Sleep (3.38) and a recovering Longevity (0.72).
The tROAS reset
Longevity PMax now targets 1.20 (reset from 6.26) and delivered 0.72 — the realistic target un-throttled delivery and value went 0.13→0.72 in one week. Caveat: Google restates conversions for days, so this 0.72 will likely drift up on the next pull — judge it at Monday’s re-read, not today.
Annotations — this week
Click to edit. E.g.: Windsor link completed Aug 4; conversions column uses Google’s fractional attribution; first full comparison week lands next Monday.
Sunny Within · Weekly Touch Base
Source: Windsor Google Ads (campaign level) · conversions are Google-attributed (fractional)
Google · Deep Dive Analytics
Retention · Klaviyo · Deep Dive

Two engaged-list sends did the lifting — the calendar still lacks an offer

Weekly Touch Base Week 34 · Aug 17 – 23, 2026
MetricThis WkLast WkWoWMTDvs Goal
Attributed Revenuegoal = 10% of Shopify rev$8,456$5,550▲ 52.4%$16.5k-71.2%
Campaign Revenue3 email + 1 SMS · all Content$4,224$2,248▲ 87.9%+5.6%
Flow Revenue50% of attributed$4,231$3,303▲ 28.1%+20.9%
Open Rate (email)delivered-weighted60.6%61.5%▼ 0.9pt+2.6pt
Email Subscribers | Engaged 365 Days+24-10▲ vs Aug 10 baseline43,242 total
Campaign Orders4323▲ 20
Diagnosis: Second straight all-Content week (3 emails + 1 SMS, no offer-led send) — revenue jumped 52% on two strong engaged-list sends, but 10.1% of Shopify vs the 35% bar is a calendar ceiling, and browse-abandon flows (owner: Peyton) sit dormant at $97. Call: Ship at least one offer-led send to the engaged segment this week and revive the browse-abandon flows.
W33 send log (revenue)
8.12 NAD Ingredients · $1,917 · 35.5k recip · 18 ord · 63.2% open
8.16 Creatine Testimonials · $1,847 · 35.2k recip · 18 conv · 63.7% open
8.14 Creatine Myths · $199 · 38.4k recip · 4 conv · 55.5% open
8.14 Creatine Myths SMS · $261 · 14.4k recip · 3 ord
The pattern in the log
All four sends were Content-tagged — no offer-led send for a second straight week. The two engaged-list sends each cleared ~$1.9k on 63%+ opens but sub-0.3% clicks; the 365-day-list send (55.5% open) earned $199.
The gap to the 35% bar is still a calendar problem, not a deliverability one.
Annotations — this week
Click to edit. E.g.: welcome flow split test started 7/30; browse-abandon flow paused for rebuild; Aug calendar adds 2 offer sends.
Sunny Within · Weekly Touch Base
Source: Klaviyo campaign + flow values reports (Placed Order U7FVaR) · list = engaged segment Xhmc6a
Klaviyo · Deep Dive Analytics
Retention · Skio Subscriptions · Deep Dive

Recurring $58.0k, first-sub $13.9k — cancels rose to 218 and deflection thinned to 6.4%

Weekly Touch Base Week 34 · Aug 17 – 23, 2026
MetricThis WkLast WkWoWMTDvs Goal
Subscription Revenuegoal $450k/mo → $101.6k/wk · MCP API basis$71,904$70,877▲ 1.4%-29.2%
First-Sub Revenue$13,881$12,03019.3% of sub revAOV $93
Recurring Revenue$58,022$56,10080.7% of sub revAOV $100
Cancellations218204▲ 6.9% more23 CA-compliance tabled
Active Subscriptionssnapshot Aug 164,7154,797▼ 82 net / wk-1.7%
3-Mo RetentionMay cohort · subscriptions basis44.0%44.0%Jun tracking 50.8%47.6% T3 avg-6.0pt vs 50%
Save Rate (W33)6.44%7.7% (of 168)15 of 233 decideddiscount 4 · skip 4 · pause 3
Diagnosis: The base bled −82 on 218 cancels while deflection ran 6.44% (15 of 233) — “too much product” (53) and “taste/texture” (47) lead, and “no longer use” saved 0 of 37. Call: Push pacing-first saves (skip/frequency before discounts) — discounts saved just 4 and the single discount owner is still TBD; June cohort tracking 50.8% says onboarding is starting to work.
Where the leak concentrates
Cancel reasons (W33): too much product 53 (4 saved) · taste/texture 47 (4) · too expensive 38 (4) · no longer use 37 (0) · Other 34.
“Too much product” is still the top reason and still a pacing fix (skip/frequency nudge before renewal), not a discount fix. “No longer use” saved 0 of 37.
Of 273 cancel-flow sessions: 40 abandoned, 185 cancelled in-flow, 23 California-compliance (tabled), 10 by merchant.
Base math
W33 flow: 147 first-time subs in vs 218 completed cancels out (185 flow + 23 CA-compliance + 10 merchant); with other moves the base netted −82 (4,797 → 4,715).
To hold the base flat at this churn we need ~230 new subs/week; current run rate is ~147.
Saves: discount 4 · skip 4 · pause 3 · swap 2 · support 1 · frequency 1 — single discount owner TBD.
Annotations — this week
Click to edit. E.g.: pre-renewal skip email test starts 8/6; NAD+ onboarding series brief with brand team; flavor-swap save branch scoped.
Sunny Within · Weekly Touch Base
Source: Skio MCP API (basis switched W33; W32 comparable restated $70,877) · cohorts browser-checked Aug 21
Skio · Deep Dive Analytics
Customer Service · Gorgias · Deep Dive

Automation 56.6% collapsed median FRT to 30 seconds — CSAT is the new watch item

Weekly Touch Base Week 34 · Aug 17 – 23, 2026
MetricThis WkLast WkWoWMTDvs Goal
Average CSATn = 14 of 774.504.64 (W32)▼ -0.14-0.10
Tickets Created128111 (W32)+15.3%volume up
Median FRT30s5m 40s (W32)▲ ~11× fasterbeats 4h
Average FRTbacklog-skewed83.9h10h 11m (W32)aged-ticket cleanupread the median
AI Automation RateAI Agent wk 256.6%14.7% (W32)▲ +41.9pt+26.6pt
Survey Response Rate18.2%13.4% (W32)▲ 14 scoredsmall n
Diagnosis: Automation 56.6% (target 30%+) put an AI first-touch on most tickets — median FRT 30s — but CSAT slipped below goal to 4.50 as the survey now hears fast-answered customers too; the 83.9h average FRT is aged-backlog cleanup, not new-ticket speed. Call: Audit low-scored AI conversations and tighten handoff guidance before pushing coverage higher.
Two FRT numbers, one story
Median 30s vs average 83.9h — the reporting API returns seconds (median 30, avg 301,925), and the mean is dragged by pre-launch backlog tickets finally being answered (human-only median 18h 15m).
Median is the honest speed read; the average normalizes as the backlog clears.
CSAT under automation
4.50 (n=14 of 77, 18.2% response) is the first below-goal print since AI Agent launch — instant answers mean the survey now samples everyone, not just the patient.
Keep the taste-complaint macro feeding Skio’s flavor-swap save; review the AI conversations behind any 1–3 scores.
Annotations — this week
Click to edit. E.g.: WISMO spiked from the W30 3PL delay; two damaged-lot tickets tie to the Shopify returns line; AI Agent scoping call Fri.
Sunny Within · Weekly Touch Base
Source: Gorgias Reporting Stats (surveys, tickets, FRT, automation) · CSAT n noted
Gorgias · Deep Dive Analytics
Organic Social · Instagram · Deep Dive

One Aug 15 post doubled engagement — follows didn’t come with it

Weekly Touch Base Week 34 · Aug 17 – 23, 2026
MetricThis WkLast WkWoWMTDvs Goal
Reachsum of daily uniques74,54181,621 (W32)▼ 8.7%95,016 deduped-12.3%
Total Interactions2,4211,110 (W32)▲ 118.1%+63.4%
Engagement Rateinteractions ÷ reach3.25%1.36% (W32)▲ 1.89ptabove goal
Accounts Engaged1,694751 (W32)▲ 125.6%spike-led
New Followersdaily new follows+234+265 (W32)▼ 11.7%+17.0%
Aug 15 Spike1,005interactions in one day▲ 709 engaged41% of week
Diagnosis: Interactions +118% and accounts engaged +126%, but the lift is one day — Aug 15 printed 1,005 interactions (41% of the week) while reach fell 8.7% and follows eased to 234. Call: Identify the Aug 15 post, make its format a weekly fixture, and pair it with a reach-friendly reel so distribution recovers.
What the numbers argue
A single day carried the week: Aug 15 drove 709 engaged accounts and 1,005 interactions — without it, depth is roughly flat week over week.
Follows fell despite doubled engagement → the spike audience interacted but didn’t convert; check that the breakout post carries a follow CTA and a pinned-profile path.
Feed the winners across channels
The Aug 15 breakout is reusable paid-social supply — route it to the Creative Needs board for Meta UGC testing.
Saturday was the engagement peak this week — test hero content on weekends, not just Thursday.
Annotations — this week
Click to edit. E.g.: founder-face reel outperformed 3:1; UGC repost rights secured from 2 creators; next week: 5 reels 1 static.
Sunny Within · Weekly Touch Base
Source: Windsor Instagram Insights (@getsunnywithin) · reach = daily-unique sums
Instagram · Deep Dive Analytics
Organic · Organic Search Rankings · Deep Dive

Brand terms back to #1, glutathione cluster slipped — the rank-diff names names

Weekly Touch Base Week 34 · Aug 17 – 23, 2026
MetricThis WkLast WkWoWMTDvs Goal
Organic SessionsGA4 medium=organic610706 (W32)▼ 13.6%1,416+1.7%
Avg Position (GSC)12.9512.7 (W32)▼ 0.25 worsemix-driven
Clicks / Impressions264 / 7,241228 / 6,846 (W32)▲ 3.65% CTRfull week
Organic Revenue$1,406 (W32)not pulled this run
Engaged Session Ratenot pulled this run
AEO VisibilityBrand Radar · methodology changed99.7% AI SoV#1 of 5 brandsAI-adjusted volume basis2 mentionsnot comparable to 86.4%
Diagnosis: The O1 rank-diff shows brand-commercial terms rebounding (“sunny within longevity” 5.8 → 1.0, “sunny within supplements” 23.8 → 3.7) while the glutathione-comparison cluster slipped 1–3 spots — that mix, plus more low-rank informational impressions, moved weighted position to 12.95 as sessions gave back 13.6%. Call: Brief a refresh on the glutathione-vs-liposomal pages; treat AEO SoV as a new baseline, not a trend point.
O1 rank-diff — the movers
Up: “sunny within longevity” 5.8 → 1.0, “sunny within supplements” 23.8 → 3.7, “sunny within nad” 29.6 → 9.3, “sunny within longevity reviews” 6.4 → 2.1.
Down: the glutathione comparisons — “glutathione vs liposomal glutathione” 9.5 → 10.6, “liposomal glutathione vs glutathione” 8.1 → 9.4, “difference between…” 6.1 → 8.8. Top non-brand query (“is avocado oil a seed oil”) improved 13.3 → 12.2 on 211 impressions.
AEO angle
AI SoV 99.7%, #1 of 5 — but Ahrefs switched to AI-adjusted volume (old calc until Aug 31), so not comparable to the 86.4% baseline. Mentions in latest responses: Sunny Within 2 (ChatGPT 1, Perplexity 1), Quicksilver 1, LivOn/Altrient/Thorne 0. Cited pages: 22 own vs 0 competitor of 74; sunnywithin.com 17 pages (cited in 2).
Source shift: pubmed.ncbi.nlm.nih.gov (6 pages, cited in 3 responses) + pmc.ncbi.nlm.nih.gov (3 pages) displaced Reddit (2 pages, cited 0) — science citations now beat community proof; keep the schema-marked science pages shipping. Prompt budget 136/150.
Annotations — this week
Click to edit. E.g.: /pages/learn refresh shipped 7/29; two blog posts lost featured snippets to a competitor roundup; brand queries stable.
Sunny Within · Weekly Touch Base
Source: GA4 medium=organic + Windsor Search Console (position impression-weighted, full week present) · AEO: Ahrefs Brand Radar, checked Aug 21 (methodology changed)
Organic Search Rankings · Deep Dive Analytics
Product · Product Performance · Deep Dive

Flagships retain, welcome offers acquire — NAD+ Complete does both

Weekly Touch Base Week 34 · Aug 17 – 23, 2026
SKUNet SalesWoWShareNew-Cust ShareActives · Aug 10
Longevity — Strawberry$24.6k▲ 4.1%29.3%13.0%1,873
Longevity$23.3k▼ 7.5%27.8%5.8%2,051
NAD+ Complete$6.8k▲ 50.2%8.1%12.2%
Cognitive$5.4k▲ 13.1%6.5%3.8%500
LS Welcome Offernew customers$3.8k▼ 43.0%4.6%19.8%
Next tier (W33)Sleep $3.3kImmunity $2.0kNAD+ WO $1.9kAug 10 snapshot
Diagnosis: The two Longevity flagships are 57% of Shopify sales but only 19% of new-customer sales — acquisition runs through the welcome offers (LS + NAD+ WO = 29% of new-cust revenue) and NAD+ Complete, up 50.2% WoW with new buyers at a third of its sales. Ratings held: no SKU crossed the 4.3★ line either way (Longevity Yotpo +12 reviews to 940). Call: Keep routing acquisition through welcome offers, watch LS WO’s −43% fade, and re-pull Skio actives next run (Aug 10 snapshot standing in).
Acquisition vs retention split
NAD+ Complete is the swing SKU: $2.4k of its $6.8k (35%) is new-customer — and it jumped 50.2% WoW.
The Longevity flagships run ~90% returning — the retention base (57% of sales, 19% of new).
Welcome offers (LS $3.8k + NAD+ $1.9k) are the acquisition rail: 29% of all new-customer revenue.
Mix moves worth testing
Cognitive +13.1% WoW on $5.4k — steady climber worth a landing-page slot.
Creatine+ sits at $1.2k with the site’s lowest Yotpo rating (4.2★, 25 reviews) — seed reviews before any paid push.
Annotations — this week
Click to edit. E.g.: NAD+ restock ETA 8/12 — watch OOS risk; Sleep $20 trial feeding Skio welcome offers; bundle test reads Friday.
Sunny Within · Weekly Touch Base
Source: ShopifyQL by product (new/returning) · Amazon ASIN unavailable this run · Skio actives: Aug 10 snapshot
Product Performance · Deep Dive Analytics
Sales · Amazon · Visual Analytics

Restated base, flat traffic, softer conversion — in four frames

Weekly Touch Base Week 34 · Aug 17 – 23, 2026
Ordered Product Sales · 13 Weeksdashed = weekly goal $32.5k
New vs Returning Revenue (AFN) · 7 Weeksshipment basis · as of Aug 9 (AFN cap)
% New Customer RevenueAFN weekly · as of Aug 9
Ads’ Share of OPSW32 vs W33 · ads rebounded, organic fell
Sunny Within · Weekly Touch Base
Source: Windsor Amazon Seller + AFN warehouse (outputs/afn-cohorts)
Amazon · Visual Analytics
Growth · Amazon Advertising · Visual Analytics

The rebound in four frames — spend back, ROAS honest

Weekly Touch Base Week 34 · Aug 17 – 23, 2026
Ad-Attributed Sales · 13 Weeksdashed = weekly goal $9.36k
New-to-Brand Share of Ad SalesW33 · SB NTB $586
Spend vs Sales · W33ROAS 3.44
CPC · W32 vs W33 vs GoalSP-only basis · creep = auction inflation
Sunny Within · Weekly Touch Base
Source: Windsor Amazon Ads (14-day attr) · some tables as of Jul 28
Amazon Advertising · Visual Analytics
Growth · Meta CRO · Visual Analytics

The paid-traffic leak moved back to the cart handoff

Weekly Touch Base Week 34 · Aug 17 – 23, 2026
Purchase Rate / LPV · 13 Weeksdashed = 4.2% goal
Pixel Funnel · W33log scale
ATC → Checkout Ratethe give-back: 84.2% → 75.4%
Meta Avg Purchase Valueheld short: 1:13 → 1:15
Sunny Within · Weekly Touch Base
Source: Windsor Meta pixel + GA4 · one attribution window
Meta CRO · Visual Analytics
Growth · Google Ads · Visual Analytics

Brand harvests — non-brand nears break-even

Weekly Touch Base Week 34 · Aug 17 – 23, 2026
Google-Attributed Revenue · 13 Weeksdashed = weekly goal $8k
ROAS · Brand vs Non-Brand4.92 vs 0.99 — NB near break-even
Share of Conversion Valuebrand = 67% — incrementality question
Spend vs Value by Campaignbrand harvests · non-brand recovering
Sunny Within · Weekly Touch Base
Source: Windsor Google Ads (campaign level) · W32 restated in the Aug 21 re-pull
Google · Visual Analytics
Retention · Skio · Visual Analytics

New basis, same leak — the base, the cancels, and what saves them

Weekly Touch Base Week 34 · Aug 17 – 23, 2026
Subscription Revenue · Weeklybasis switched W33 (API): Skio MCP reads ~3% above the old browser basis (W32: $70,877 vs $68,520)
W33 Base Flowgained vs lost, by source
Cancel Reasons · W33% of cancel-flow sessions
W33 Revenue Mixfirst vs recurring vs add-on
Sunny Within · Weekly Touch Base
Source: Skio MCP API (basis switched W33) · history W28–W32 on old browser basis
Skio · Visual Analytics
Customer Service · Gorgias · Visual Analytics

AI first-touch changed every frame

Weekly Touch Base Week 34 · Aug 17 – 23, 2026
Average CSAT · 13 Weeksdashed = 4.60 goal · small weekly n
Median FRT (minutes)goal 4h = 240m · avg is backlog-skewed
Tickets CreatedW32 vs W33 · volume up 15%
Survey Funnel · W3314 of 77 scored — 18.2% response
Sunny Within · Weekly Touch Base
Source: Gorgias Reporting Stats
Gorgias · Visual Analytics
Organic Social · Instagram · Visual Analytics

Top 5 organic posts · 30-day engagement leaders

top 5 organic posts by engagement (likes + comments + saves + shares) · trailing 30 days to Aug 30 · feed and reels · 1 of 5 from the reporting week · click a card to open it on Instagram top 5 organic posts by engagement (likes + comments + saves + shares) · trailing 30 days to Aug 30 · feed and reels · 1 of 5 from the reporting week · click a card to open it on Instagram top 5 organic posts by engagement (likes + comments + saves + shares) · trailing 30 days to Aug 30 · feed and reels · 1 of 5 from the reporting week · click a card to open it on Instagram top 5 organic posts by engagement (likes + comments + saves + shares) · trailing 30 days to Aug 30 · feed and reels · 1 of 5 from the reporting week · click a card to open it on Instagram top 5 organic posts by engagement (likes + comments + saves + shares) · trailing 30 days to Aug 23 · feed and reels · 1 of 5 from the reporting week · click a card to open it on Instagram top 5 organic posts by engagement (likes + comments + saves + shares) · trailing 30 days to Aug 23 · feed and reels · 1 of 5 from the reporting week · click a card to open it on Instagram
Weekly Touch Base Week 34 · Aug 17 – 23, 2026
Sunny Within · Weekly Touch Base
Source: Windsor Instagram Insights (@getsunnywithin) · posters re-hosted on Shopify CDN (@getsunnywithin) · posters re-hosted on Shopify CDN (@getsunnywithin) · posters re-hosted on Shopify CDN (@getsunnywithin) · posters re-hosted on Shopify CDN (@getsunnywithin) · posters re-hosted on Shopify CDN (@getsunnywithin) · posters re-hosted on Shopify CDN
Instagram · Visual Analytics
Organic Social · Social Mentions · Visual Analytics

Top 5 creator mentions · ranked by earned media value

top 5 by earned media value · trailing 30 days to Aug 30 · 1 of 5 from the reporting week · 47 mentions in the window from 35 creators · one card per creator, roundups (>8 brands tagged) capped at one · EMV is Archive’s estimate — directional, never sum it into revenue or set it beside Meta spend · views, reach and saves are null on this feed, so this board cannot be read row-for-row against the Instagram slide
Weekly Touch Base Week 34 · Aug 17 – 23, 2026
Organic · Organic Search Rankings · Visual Analytics

Brand rank rebounded, comparisons slipped

Weekly Touch Base Week 34 · Aug 17 – 23, 2026
Organic Sessions · 13 Weeksdashed = weekly goal 600
Avg Position (GSC)lower is better — 12.7 → 12.95
GSC Clicks · W32 vs W33clicks up despite fewer sessions
GSC Impressions · W32 vs W337,241 — demand still growing
Sunny Within · Weekly Touch Base
Source: GA4 + Windsor Search Console (lags ~2d)
Organic Search Rankings · Visual Analytics
Product · Product Performance · Visual Analytics

The mix in six frames — ratings hold the 4.3★ line

Weekly Touch Base Week 34 · Aug 17 – 23, 2026
Share of Net Sales · W34top 5 · Shopify only
New-Customer Share vs Total Shareover-index = acquisition SKU
Skio Actives by SKUAug 10 snapshot · not re-pulled
WoW Growth by SKUNAD+ Complete +50% WoW
Product Ratings · Shopify vs Amazonmonthly cadence · snapshot Aug 21 · no 4.3★ crossings
Review Counts · Shopify vs Amazonmonthly cadence · snapshot Aug 21 · Longevity widget pooled at 940
Sunny Within · Weekly Touch Base
Source: ShopifyQL + Windsor + Skio · ratings: Yotpo widgets + Amazon listings (browser, snapshot Aug 21)
Product Performance · Visual Analytics
Retention · Landing Page Optimization

The most traffic went to the worst page — and the winner slipped under goal

Weekly Touch Base Week 34 · Aug 17 – 23, 2026
Blended LP Conversion Rate
1.70%
vs paid PR/LPV-1.75pt Best LP3.37%
LP CVR vs 4.00% Goal
▲ Now Testing
Click to edit — seeded suggestion:
Sleep-Welcome rebuild · clone the Strawberry-Welcome layout onto /longevity-and-sleep-welcome-offer (1.41% vs 5.28%)
owner · started · leading variant
▶ Queued
Suggested from data:
1. Headline message-match on /pages/longevity-cognitive (2.26% on 1,150 sess)
2. Winner routing: point 052/037-A ads at the Strawberry-Welcome page
✓ Shipped
Log wins here with measured lift — e.g. “LP-B headline → +0.7pt PR/LPV, rolled out Fri”. This column is the program’s memory.
Winner vs Loser · W33
Strawberry Welcome Offer
3.37% CVR · $3.31/session · 743 sessions
NAD Solo
1.21% CVR · $1.06/session · 2,072 sessions
Loser at winner’s rate = +$4.7k/wk
Per-LP Scoreboard (GA4 · W33)
/products/longevity-strawberry-welcome-offer · 743 sess · 3.37% · $3.31/s · ads: LS-Welcome
/pages/longevity · 798 sess · 1.75% · $1.80/s · brand + email
/pages/longevity-cognitive · 581 sess · 1.55% · $1.85/s · ads 105 & 024
/pages/longevity-and-sleep-welcome-offer · 802 sess · 1.50% · $1.41/s · ad 030
/pages/nad-solo · 2,072 sess · 1.21% · $1.06/s · ads 052 & 037-A
Sunny Within · Weekly Touch Base
Source: GA4 landingPage (splits; captures ~32% of revenue) · ad assignment from Meta ad-name taxonomy · test columns save locally
Retention · Landing Pages
Website · Website Analytics (CRO)

CVR 2.62% — more sessions, softer intent; checkout kept healing

Weekly Touch Base Week 34 · Aug 17 – 23, 2026
Sol’s read

Conversion slipped again to 2.62% (−0.33pt) — but on 12% more sessions (9,920), so the story is mix, not decay: session→cart eased to 6.4% and ATC→checkout fell to 81%, while checkout completion improved a third straight week to 50.8% (+1.7pt). The driver is the incoming traffic shift — nad-solo landed 2,072 sessions at a 1.21% LP CVR (see Landing Pages) — and GA4 splits agree: mobile 2.54% vs desktop 2.28%, neither collapsing. MTD CVR sits at 2.89% on 21,521 sessions against the 4.00% goal. The Deep Dive prices the remaining checkout gap at ~38 orders. Team notes: click to annotate.

Sitewide Conversion Rate
2.62%
vs Goal-1.38pt vs PW-0.33pt
CVR vs 4.00% Goal
Checkout Completion
50.8%vs PW+1.7pt
512 checkouts → 260 orders
still ~7pt below the W29 58.2% bar
Revenue / Session
$8.46ShopifyCVR × AOV
$84.0k on 9,920 sessions
AOV $93.55 (+1.7%)
Device Gap
+0.26ptdesktop lags2.28%
Mobile 2.54% CVR · 79% of sessions
Gap widened — desktop audit stays open
Checkout Completion
103sGA4mobile
Desktop 144s · tablet 130s
Engagement holds — intent is the issue
Sitewide CVR · Weekly (history builds from here) dashed = 4.00% goal · W30 backfills on next refresh
Sunny Within · Weekly Touch Base
Source: Shopify Analytics (funnel, CVR, revenue) + GA4 (device & engagement splits — captures ~32% of revenue, splits only)
Website · Website Analytics
Retention · Landing Pages · Deep Dive

For the first time, even the winner is under the 4% bar

Weekly Touch Base Week 34 · Aug 17 – 23, 2026
Landing PageSessionsCVRRev / SessionRevenuevs Winner
/products/longevity-strawberry-welcome-offerthe winner — now under goal7433.37%$3.31$2,461baseline
/pages/longevity7981.75%$1.80$1,435-1.62pt
/pages/longevity-cognitiveads 105 + 024 ✓5811.55%$1.85$1,075-1.82pt
/pages/nad-soloads 052 + 037-A ✓ · most traffic2,0721.21%$1.06$2,189-2.16pt
/pages/longevity-and-sleep-welcome-offerad 0818021.50%$1.41$1,129-1.87pt
Homepage / (reference)1,8034.33%$4.42$7,969brand traffic
/pages/nad-solo-pdp-stylesmall n — PDP-style variant2510.80%$0.61$154-2.57pt
Diagnosis: Blended LP CVR fell to 1.70% (−0.53pt) because nad-solo took the most traffic (2,072 sessions, up from 820) at the worst rate (1.21%) — and the winner itself slipped under the 4% goal for the first time (3.37%, was 4.65%). Call: Fix the traffic mix first — reroute nad-solo spend to Strawberry-Welcome — and run the 4-week dead-page rule: any page 4 straight weeks under goal gets rebuilt or retired.
The gap, priced
If nad-solo earned the winner’s $3.31/session, its 2,072 sessions would have produced +$4.7k this week — the traffic-mix shift (820 → 2,072 sessions at 1.21%) is now the single biggest CRO lever on the site.
Second prize: Sleep-Welcome at $1.41/session on 802 sessions.
What the winner does differently
The Strawberry Welcome Offer is still a product page with the offer priced in — but even it slipped to 3.37% (from 4.65%), its first week under the 4% goal. Diagnose whether the dip is colder traffic mix or the page itself; the 4-week dead-page clock now applies to every page on the board.
Annotations — this week
Click to edit. E.g.: confirm ad→LP assignments; sleep-welcome rebuild kickoff; PageSpeed pull scheduled.
Sunny Within · Weekly Touch Base
Source: GA4 landingPage dimension · GA4 captures ~32% of revenue — use rows for comparison, not totals
Landing Pages · Deep Dive Analytics
Retention · Landing Pages · Visual Analytics

Five pages — and the traffic went to the worst one

Weekly Touch Base Week 34 · Aug 17 – 23, 2026
CVR by Landing Pagewinner vs the field
Revenue per Session by LPthe money view
Session Distributionwhere traffic actually goes
Winner vs Losersame click cost, 3.1× the return
Sunny Within · Weekly Touch Base
Source: GA4 landingPage (comparison basis)
Landing Pages · Visual Analytics
Website · Website Analytics · Deep Dive

The funnel in numbers — the leak moved upstream to the cart step

Weekly Touch Base Week 34 · Aug 17 – 23, 2026
MetricThis WkLast WkWoWMTDvs Goal
Sitewide CVRgoal 4.00%2.62%2.95%▼ 0.33pt2.89%-1.38pt
Revenue / Session$8.46$9.22▼ 8.2%Shopify
Sessions9,9208,843▲ 12.2%21,521traffic up
Session → ATC6.4%6.6%▼ 0.2ptintent soft
ATC → Checkout81.0%91.3%▼ 10.3ptwatch
Checkout → Purchaserebuilding50.8%49.1%▲ 1.7pt-7.4pt vs W29 58.2%
Mobile CVR (GA4)2.54%79% of sessionsleads
Desktop CVR (GA4)2.28%▼ 0.26pt vs mobileaudit
Diagnosis: CVR 2.62% (−1.38pt vs the 4% goal) on +12% sessions — the leak moved upstream: session→cart 6.4% and ATC→checkout −10.3pt, while checkout completion improved again (+1.7pt to 50.8%). This is intent/mix, not mechanics — the shift to low-CVR nad-solo traffic (see Landing Pages). Call: Push the LP/traffic rerouting first; no checkout changes while completion trends up.
The leak, priced
At W29’s 58.2% completion, 512 checkouts = 298 orders; we got 260 — ~38 orders ≈ $3.6k still on the table, but the gap narrows each week (46.9 → 49.1 → 50.8). The new leak is upstream: only 6.4% of 9,920 sessions carted and 81% of carts reached checkout (was 91%).
Attribution health
GA4 recorded $24.7k of Shopify’s $84.0k (~29% capture) — consent + blockers. House rule: Shopify owns totals and money; GA4 owns splits (device, landing page, engagement). Never mix the two in one ratio.
Annotations — this week
Click to edit. E.g.: Shop Pay incident Thu 2–4pm confirmed; desktop checkout extension audit booked; bundle test price display fixed Fri.
Sunny Within · Weekly Touch Base
Source: ShopifyQL funnel + GA4 device/engagement · GA4 = splits only
Website Analytics · Deep Dive Analytics
Website · Website Analytics · Visual Analytics

The funnel, the device split, and a rebuilding checkout

Weekly Touch Base Week 34 · Aug 17 – 23, 2026
Sitewide Funnel · W33log scale · Shopify
Checkout Completioncompletion 50.8% — third week rebuilding
CVR by Device (GA4)desktop is the laggard
Engagement Rate by OSGA4 splits · seconds
Sunny Within · Weekly Touch Base
Source: ShopifyQL + GA4 splits
Website Analytics · Visual Analytics
Meeting Agenda · Cameron


Weekly Touch Base  
This week’s KPI   
Performance to plan
Priorities for this week
Drivers to performance
Highlights
Ideas
Sunny Within · Weekly Touch Base
Owner block · written in Notion before the call
Cameron · Agenda
Meeting Agenda · Trisha


Weekly Touch Base  
This week’s KPI   
Performance to plan
Priorities for this week
Drivers to performance
Highlights
Ideas
Sunny Within · Weekly Touch Base
Owner block · written in Notion before the call
Trisha · Agenda
Meeting Agenda · Peyton


Weekly Touch Base  
This week’s KPI   
Performance to plan
Priorities for this week
Drivers to performance
Highlights
Ideas
Sunny Within · Weekly Touch Base
Owner block · written in Notion before the call
Peyton · Agenda
Meeting Agenda · Jaizsha


Weekly Touch Base  
This week’s KPI   
Performance to plan
Priorities for this week
Drivers to performance
Highlights
Ideas
Sunny Within · Weekly Touch Base
Owner block · written in Notion before the call
Jaizsha · Agenda
Meeting Agenda · Damian


Weekly Touch Base  
This week’s KPI   
Performance to plan
Priorities for this week
Drivers to performance
Highlights
Ideas
Sunny Within · Weekly Touch Base
Owner block · written in Notion before the call
Damian · Agenda
Meeting Agenda · Katie


Weekly Touch Base  
Blocked · needs a decision
Priorities for this week
Sunny Within · Weekly Touch Base
Owner block · written in Notion before the call
Katie · Agenda
CRO · Intelligems

Every test, and how close it is to callable

8 experiments · 3 running, 1 pending, 4 ended · Intelligems issues a verdict past roughly 7 days live and 300 orders per group
Weekly Touch BaseWeek 34 · Aug 17 – 23, 2026
Longevity-sleep · Layout SequenceRUNNINGSTOP IT
6 orders in the smaller group2% of the 300 bar
Creatine PDP · Product Copy CheckmarksRUNNINGNOT READY
12 orders in the smaller group4% of the 300 bar
NAD+Solo Lander · Above the FoldRUNNINGNOT PULLED
metrics not pulled this week
Price Change Test · Aug 17PENDINGNOT STARTED
not started
META · Longevity Strawberry Bubbles CopyENDEDDIRECTIONAL
13 orders in the smaller group4% of the 300 bar
Longevity-cognitive · Layout SequenceENDEDNOT PULLED
metrics not pulled this week
Meta Lander No OTP Discount · Long+CogENDEDNOT PULLED
metrics not pulled this week
Meta Lander No OTP Discount · Long+SleepENDEDNOT PULLED
metrics not pulled this week
Sunny Within · Weekly Touch Base
Source: Intelligems · pulled Aug 27, 2026
Intelligems · Summary
CRO · Intelligems

Lift, ranked — and whether it is real yet

revenue per visitor against control, with 95% confidence · the three tests with metrics pulled this week
Weekly Touch BaseWeek 34 · Aug 17 – 23, 2026
TestOrdersVisitorsRevenue / visitor lift vs control  −100%  0  +100%Prob.Read
Creatine PDP copy
Control Group vs Product Benefits Copy
31
orders
332
visitors
86%
to beat ctl
NOT READY
Strawberry bubbles copy
Control Group vs Benefits Bubbles
30
orders
881
visitors
74%
to beat ctl
DIRECTIONAL
Longevity-sleep layout
Control Group vs Re-Order Page
26
orders
1,460
visitors
0%
to beat ctl
STOP IT
The bar is revenue-per-visitor lift against control; the whisker is its 95% confidence interval. A whisker crossing the centre line means the test cannot yet separate a win from noise — which is true of all three. The largest has 31 orders across both groups against a ~300-per-group bar.
Sunny Within · Weekly Touch Base
Source: Intelligems get_variation_overview · Aug 27, 2026
Intelligems · Deep Dive Analytics
CRO · Intelligems

What actually changed on the page

pick a test — both frames are the live page at the same scroll, one per arm · greyed tests have no metrics pulled this week
Weekly Touch BaseWeek 34 · Aug 17 – 23, 2026
Longevity-sleep
Running · Stop It
Creatine PDP
Running · Not Ready
NAD+Solo Lander
Running · Not Pulled
Price Change Test
Pending · Not Started
META
Ended · Directional
Longevity-cognitive
Ended · Not Pulled
Meta Lander No OTP Discount
Ended · Not Pulled
Meta Lander No OTP Discount
Ended · Not Pulled
Sunny Within · Weekly Touch Base
Source: Intelligems onsiteEdits + live page capture · Aug 27, 2026
Intelligems · Visual Analytics
Growth · Meta Destinations

Where Meta spend actually lands

all 114 ads · $32,650 = 100% of Meta spend · 6 paginated pulls, per-ad sums reconcile to the account total
Weekly Touch BaseWeek 34 · Aug 17 – 23, 2026
Dedicated lander/pages/*
$28,81988% of Meta spend
97 ads across 4 destinations · 141 purchases
stripped header, single CTA, no nav escape routes
CPA
$204.39
AOV
$97.58
ROAS
0.48
Destinations · spend · CPA
/pages/nad-solo$15,859$214.32
/pages/longevity-and-sleep-welcome-offer$7,772$185.04
/pages/longevity$4,725$205.44
/pages/nad-solo-pdp-style$463$231.41
Offer PDP/products/*-welcome-offer
$3,83112% of Meta spend
17 ads across 1 destination · 18 purchases
full product template + site nav + variant picker, at an offer price
CPA
$212.84
AOV
$108.60
ROAS
0.51
Destinations · spend · CPA
/products/longevity-strawberry-welcome-offer$3,831$212.84
True PDPbare /products/*
$0no spend lands here
This empty bucket is the finding. Across all 114 ads, not one Meta dollar reaches a bare product page — every dollar lands on an offer page.
Destinations
none — at 100%% coverage
Sunny Within · Weekly Touch Base
Source: Parker · landing_url with ad-name field 10 fallback · Aug 27, 2026
Meta Destinations · Summary
Growth · Meta Destinations

Every destination, ranked by spend

and how each one was classified · all 114 ads · $32,650 = 100% of Meta spend · 6 paginated pulls, per-ad sums reconcile to the account total
Weekly Touch BaseWeek 34 · Aug 17 – 23, 2026
DestinationAdsSpendPurchCPAAOVROASClassified by
/pages/nad-soloDedicated lander
89
$15,859
74
$214.32
$91.72
0.43
landing_url
/pages/longevity-and-sleep-welcome-offerDedicated lander
1
$7,772
42
$185.04
$106.13
0.57
field10:LPLongevitySleepWelcome
/pages/longevityDedicated lander
6
$4,725
23
$205.44
$103.95
0.51
landing_url + field10:LongevitySolo
/products/longevity-strawberry-welcome-offerOffer PDP
17
$3,831
18
$212.84
$108.60
0.51
landing_url
/pages/nad-solo-pdp-styleDedicated lander
1
$463
2
$231.41
$61.78
0.27
landing_url + field10
Classifier: landing_url first, ad-name field 10 as fallback. 2 of 5 destinations resolve on URL alone; the rest need field 10 — including the $15,859 spend leader, which has no landing_url in Parker. The field-10 lookup is learned, not assumed: each mapping was observed on an ad carrying both signals. Neither signal alone covers the account — every [AI] and (Expiring…) ad lacks the naming convention, and those are exactly the ones Parker has URLs for.
Sunny Within · Weekly Touch Base
Source: Parker search_facebook_ads_sql · Meta default attribution
Meta Destinations · Deep Dive Analytics
Growth · Meta Destinations

The pages the money lands on

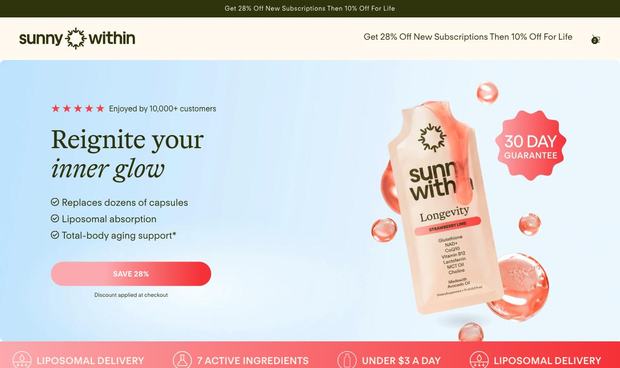
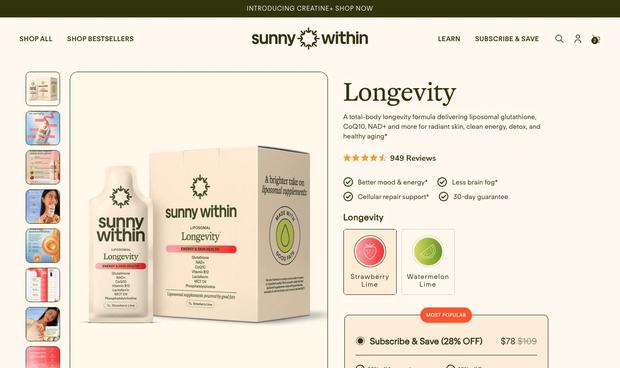
each destination as visitors see it, with the spend behind it · ordered by spend · the sleep lander is shown on its Intelligems control arm · 4 of 5 destinations captured = 98.6% of Meta spend (/pages/nad-solo-pdp-style not yet shot)
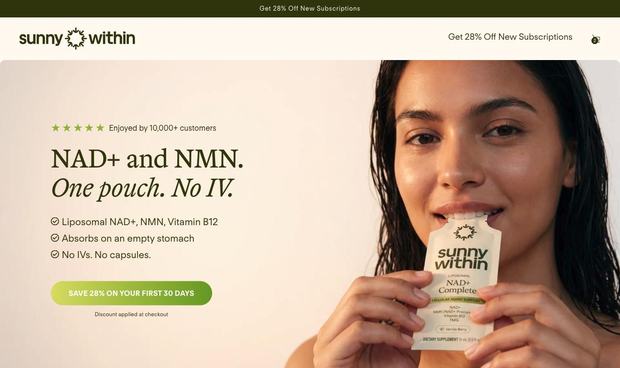
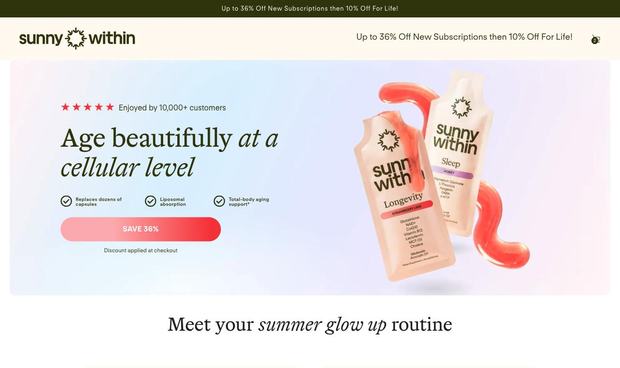
Weekly Touch BaseWeek 34 · Aug 17 – 23, 2026
lander/pages/nad-solo49%
$15,859 spendCPA $214.32AOV $91.7289 ads
lander/pages/longevity-and-sleep-welcome-offer24%
$7,772 spendCPA $185.04AOV $106.131 ad
lander/pages/longevity14%
$4,725 spendCPA $205.44AOV $103.956 ads
Offer PDP/products/longevity-strawberry-welcome-offer12%
$3,831 spendCPA $212.84AOV $108.6017 ads
Sunny Within · Weekly Touch Base
Source: live page capture at 1280px · Aug 27, 2026
Meta Destinations · Visual Analytics


Weekly Touch Base Week 34 · Aug 17 – 23, 2026


Sunny Within · Weekly Touch Base
Nested page · content to be built
 
Media is served straight from Parker.